In 1976, pioneering breast radiologist, John Wolfe, published results he’d been working on for the prior decade — that is, certain mammographic patterns being associated with an increased risk for breast cancer. This wasn’t your measly “4-6X” risk that emerged (with much confusion) in modern times, but a 37-fold increased risk imparted by the now-infamous “DY” pattern. Translated to absolute risk, that’s 45% breast cancer risk for women aged 40-59, and a whopping 82% risk if focused only on the 50-59 age group. And with that in mind, Dr. Wolfe recommended that those women identified with the DY pattern undergo preventive subcutaneous mastectomies, a new procedure being promoted by the plastic surgeons (for a variety of indications) upon the introduction of silicone implants.
The curious thing about Wolfe’s landmark article and his recommendations is that he divided mammographic patterns into 4 categories (the same number we have today), but the divisions were based on breast cancer risk, NOT the likelihood of missed cancer, i.e., “sensitivity.” The N1 category was “predominantly fatty” and was associated with such a low cancer risk that screening was not needed. P1 meant less than 25% “prominent ducts” and again, low risk for cancer, so no pressing reason to screen. P2 was defined as greater than 25% “prominent ducts” and screening was now advised due to the risk status. DY was dense fibroglandular tissue with very high risk (analogous to today’s Level D), to the point that Wolfe made his remarkable recommendation for preventive surgeries for all DYs. In 1980, when I began private practice in Los Angeles, all mammography reports included the Wolfe classification, though we had no idea what purpose it served since interventions were unproven, and screening recommendations were new. None of the recommendations from various organizations included Wolfe in their guidelines.
Turns out, Wolfe’s methodology was flawed for a variety of reasons. First of all, most of the women he studied had symptoms of some sort. That is, they were not asymptomatic, which is required today before calling a study “screening.” So, for example, when a patient in his study with a DY pattern developed breast cancer 7 months after a negative mammogram, Wolfe felt the DY pattern, as a strong risk factor, had accurately predicted a future cancer. But this wasn’t the case at all! He was witnessing the extraordinarily high “miss rate” for mammography when women have dense breast tissue. The cancer was there on the prior mammogram, but not visible due to the camouflaging effect of density! He was correctly observing a relationship between density levels and breast cancer, but misunderstanding the true reason for his observations. Ever since then, we have struggled to recognize that there are two related, albeit independent, implications of high mammographic density — 1) a modest risk factor, and 2) the strongest predictor for missing a cancer on routine screening (“poor sensitivity”).”Wolfe patterns” came and went, and after that, trying to relate breast cancer risk to mammographic patterns fell into a state of hibernation. Any attempts to document increased risk associated with density patterns went unnoticed by clinicians. We had moved “beyond Wolfe,” it seemed. At the same time, an enormous effort was engineered by the American Cancer Society and others to promote mammographic screening. In these efforts, mammographic sensitivity was said to be “90-95%.” As it turns out, this “90-95%” was based on a large feasibility study (the BCDDP, not the randomized controlled trials that proved screening saves lives) where many of those entering the massive BCDDP study had palpable masses. Stage II cancers outnumbered Stage 0 and Stage I combined. “90-95%” was never true for asymptomatic women, yet it dominated thought for another decade or so. Few clinicians were paying attention to the rather large number of cancers that were being missed on screening mammograms. This should be no surprise. How do you recognize and count the number of missed cancers if you’ve missed them already? The standard approach was to count cancers that emerged after negative mammograms for a period of 12 months of follow-up, but this was arbitrary and unreliable. (Adjunct imaging to identify missed cancers was not yet available.) For palpable cancers — yes, the sensitivity was 90%. But that’s not screening, and we failed to make that distinction in those early years. The definition of mammographic screening evolved to imply asymptomatic patients (no palpable masses), and it was here that the sensitivity of mammography was largely unknown to clinicians.
Then, technical developments took place in the 1990s with ultrasound (US). No longer was US just a matter of cyst vs. solid, but it could distinguish benign vs. malignant. And with this development, many radiologists launched studies to screen asymptomatic women with US, after negative mammograms…IF the breast tissue was dense. There were no definitive trials at first, that is, no prospective randomized studies. But the results with US were numerically consistent across the board. Mammograms weren’t coming close to 90-95% sensitivity in women with dense breasts. Completely independent of “future risk,” breast density was predicting mammographic failure due to the camouflage effect. Arguably, this failure to detect cancer is much more significant than the modest risk imparted by density (more on this below).
Then, in the early 2000s, the introduction of MRI into the breast clinic turned the sensitivity problem upside down — that is, mammography alone in high-risk women was missing more cancers than it was finding. Sensitivity was 40% across the board in the MRI screening trials. This was a far cry from the “90-95%” starting point 25-30 years earlier. Granted, MRI lowered the threshold of detection to smaller tumors, which made both mammography and US look worse. On the other hand, ultrasound did not lower the threshold of detection, so for purists, US probably reflects the miss rate of mammography more fairly. Nevertheless, what MRI is doing becomes clear when the numbers are examined — MRI is finding current breast cancers that are invisible on mammography and/or US, then — by lowering the threshold of detection, it is also finding most of the breast cancers that won’t be discovered until the next routine screening study, 1 or 2 years away.
Back to Breast Density. Overcoming the “false alarm” by Wolfe was not easy. I was once part of a team of primarily academic radiologists who taught MRI to other radiologists around the country, shortly after MRI was introduced. I was the token surgeon. In one of my talks on MRI screening guidelines, I pointed out the overwhelming evidence that breast density was an independent risk factor for breast cancer development. This was nowhere near the Wolfe levels, but the positive results were similar in more than 10 studies. So, why was no one paying attention? I don’t know. Were they remembering the collapse of the Wolfe criteria? In my presentations, I likened breast density to comedian Rodney Dangerfield — “No Respect.” Breast density was not part of the mathematical models that estimate risk. It was not used clinically with regard to any screening recommendations with any modality (It’s still not considered a problem requiring multi-modality imaging by the U.S. Preventive Services Task Force!). And, when added to the MAJOR problem of failing to detect breast cancer, density was — well — it was Rodney Dangerfield’s calling card: “I don’t get no respect.”
I don’t think I made a dent in the lack of interest in breast density. What made the difference was a grassroots movement launched when women discovered the truth – that many of them had mammograms so dense that cancer detection was nearly impossible, yet no one told them! (I’ve covered this story about the late Nancy Cappello in other blogatorials.) Today, we celebrate legislation that forces radiologists to talk to patients about this problem, but how in the world did we get to the point where this had to be legislated? I started a High Density counseling program and clinic at my facility just as soon as we opened our MRI screening program in 2003. And, I published a point system for MRI screening where Density played an equal role to Risk level. In my mind, density was even more important than risk level. After all, why talk about a second form of imaging if you don’t take into account the failure rate of the first modality?
Yet, when the American Cancer Society released their 2007 guidelines for MRI screening, “Density” was relegated to the “need more research” category. And it’s been a brick wall ever since. We also published our local MRI screening results before and after the ACS guidelines, wherein one-half of our MRI-discovered cancers would not have been found if we’d followed the ACS guidelines. By including density, our MRI cancer yield doubled. Europe is way ahead of the U.S. on this one. The European Society of Breast Imaging has recently added a screening approach for women with Level D density, with no other risk factors: “Breast MRI every 2-4 years.”
So, even though radiologists must divulge high density levels to patients, not everyone will counsel patients at that point as to options. Even if options are discussed, the breast center must understand that insurance often will not pay for high-density screening beyond mammography (following the Task Force guidelines). So, the breast center should have low-cost programs for cash customers who have opted for US or MRI (but that’s another story — many hospital-based breast centers don’t like that “low-cost option.”)
Now, in spite of the powerful presence of “breast density” in the screening world today, there are points of confusion still circulating. I’ll mention 6 of them:
- “Density imparts a 4-6 fold risk of breast cancer.” This is highly misleading, as this is a “relative risk,” and all relative risks have a numerator and a denominator. In this case, the denominator is those women with fatty replacement pattern (Level A). This is only 10% of the population and hardly “average.” So, yes, comparing Level D to Level A generates “4-6 fold risk.” But if you compare Level D to the “average patient” then the Relative Risk becomes a much more manageable 2-fold risk. This misconception was so pervasive initially that huge efforts were made to educate physicians about these numbers, and the problem has been largely corrected. Most clinicians have been exposed now to this misconception, though it still leaks out occasionally.
- “The risk imparted by density is now covered nicely by the Tyrer-Cuzick (TC) model.” Careful. The referent (where RR=1.0) in the TC model is essentially Level C density. Not Level A. Not Level B. So now, patients who have been labeled as “dense” Level C and a slight increase in breast cancer risk will actually have Zero risk (RR=1.0) added by density using Version 8.0 of the TC model. So, “high risk” when speaking of dense breasts in general, but “no elevated risk” for Level C when using the TC model. Only Level D translates to higher absolute risk in the TC model. Level C is neutral, while Levels A & B will actually generate lower levels of risk with the newer Version 8.0 (RRs less than 1.0).
- “Dense and non-dense is the currently preferred approach in defining women for specialized screening.” What we really have is a density continuum from 0 to 100% (the practice of medicine “hates” continuums, as we need to stratify our strategies.) Furthermore, we have a classic Bell Curve, with most patients bunched up in the middle where the Level B and Level C patients dominate, accounting for 80% of the total. So, when we turn this into a dichotomy, we draw a line down the middle of the Bell Curve, and there is little difference between a high Level B and a low Level C. In fact, it is highly subjective, and radiologists don’t necessarily agree; even a single radiologist can be inconsistent. Yet, this is where most women are due to the Bell curve — either “high B or low C.” But the “dense and non-dense” dichotomy (A/B or C/D) implies a sharp distinction that’s just not there.
- “Software is now available to take away the subjectivity.” While it is impressive to see exact percentages emerge with these tools, you can’t get away from the Bell Curve. Most women are clustered right at the division line, with huge differences in management depending on which side one falls. This limitation (confusion?) has been created through the simultaneous use of a dichotomy (by the grassroots movement) and the 4 Levels A-D from the American College of Radiology. If we’re going to use 4 levels, then each level should have unique recommendations. Another problem that is not addressed by software packages — there is a qualitative feature of density in addition to the well-known quantitative. This qualitative aspect is exceedingly complex and beyond discussion here. However, to give a practical example, I create a dime-sized mass in my head, then move it throughout the white areas of a mammogram to see if there’s somewhere a cancer could hide, even in low density patients. If you are a clinician, think about those mammograms where the only density is a homogeneous white sheet confined to the upper outer quadrants. This will be a Level B patient with only 25% density, but if cancer develops in the UOQ, it’s going to hidden, just as if the patient were Level D. Remember, overall breast density is merely a surrogate for the density that surrounds a cancer. And, this could even be a worse problem, considering that these dense patches might be where cancer originates. (P.S. If you think this sounds overly compulsive (nuts), then read about the Entry requirements for ACRIN 6666 (density + one additional risk factor, studying multimodality screening). A patient could qualify with a low overall density if there was a homogeneous white region involving just one quadrant in each breast. Level A in 3 quadrants, Level D in one quadrant, but instead of a fusion to Level B, patients qualified for ACRIN 6666). You can see that the risk of missing a cancer on mammography has this qualitative aspect in addition to the 4 quantified levels.
- “Density disappears with Age.” Radiologists know this isn’t true, but many clinicians (and epidemiologists who set screening guidelines) believe that extra imaging with US or MRI will not be needed after a certain age (60, for example) because low density translates to mammographic accuracy. While this transition to less density might be true overall in a large cohort, there are many exceptions to this rule. We’ve all seen the 70 y/o with Level D density. And, when encountering the young woman with Level D density, it might improve somewhat over time, but she is going to remain dense her whole life, even though a shift down is possible. This controversy comes up in the MRI screening guidelines where older women are discriminated against with “lifetime risk” calculations. Older women have passed through much of their lifetime risk, so they don’t qualify for MRI screening, yet their short-term risk might be very high — much higher than a younger woman who qualifies on the basis of many years left in her lifetime risk. I’ve tried to make this point in publications and at screening guideline meetings, and am met with, “the MRI guidelines were intentionally designed for younger women with dense breasts.” Fine. Agreed. But what about the older woman with dense breasts? They can be included without taking away any of the benefit for younger women. And, the answer is so easy — just add short-term risk calculations alongside the lifetime calculations. On this point, I’ve made about as much headway as Rodney Dangerfield.
- “3D tomosynthesis has solved the density problem.” Or, the way a patient might state the issue — I’d like to stop Ultrasound (or MRI) now that we have 3D mammography.” Sorry, but 3D is not even close to solving the density problem. It helps, yes, but let me put this in perspective. Shortly after the introduction of 3D, an Italian study pitted 3D mammography compared to old-fashioned 2D plus Ultrasound. It wasn’t even close. The combination of 2D plus US discovered many more cancers than 3D. It gets worse. A clinical trial in the U.S. pitted breast MRI against 3D mammography. MRI found 95.7% of the cancers while 3D found…wait for it….39.1%.
Is there any hope for the patient with dense breasts, short of MRI? Yes. While Ultrasound is currently thought to be the next best thing to MRI in high-density screening, Contrast-enhanced mammography (CEM) is more sensitive than ultrasound and might be the answer. We’ve already seen the numbers. CEM is using a radiologic dye, injected prior to the 3D mammogram. Results appear to be in the same ballpark with MRI, though more definitive studies are being performed now. We know enough already that CEM can be recommended when patients are unable to undergo MRI for some reason. And, CEM is easier on patients, and cheaper. The question is whether or not it can replace MRI rather than its current role as a comparable back-up.
PS – I’d be remiss if I didn’t mention the ultimate answer (in my mind) to all the mess above, and even more mess I haven’t addressed with using Risks and Density to guide adjunct imaging recommendations. If we had a reliable screening blood test, then women could undergo mammography and blood testing as a matter of routine. And if mammograms were negative, but blood test positive, this would be the signal for adjunct US, CEM, or MRI. (That’s why I’ve been pursuing this agenda for the past 30 years.)
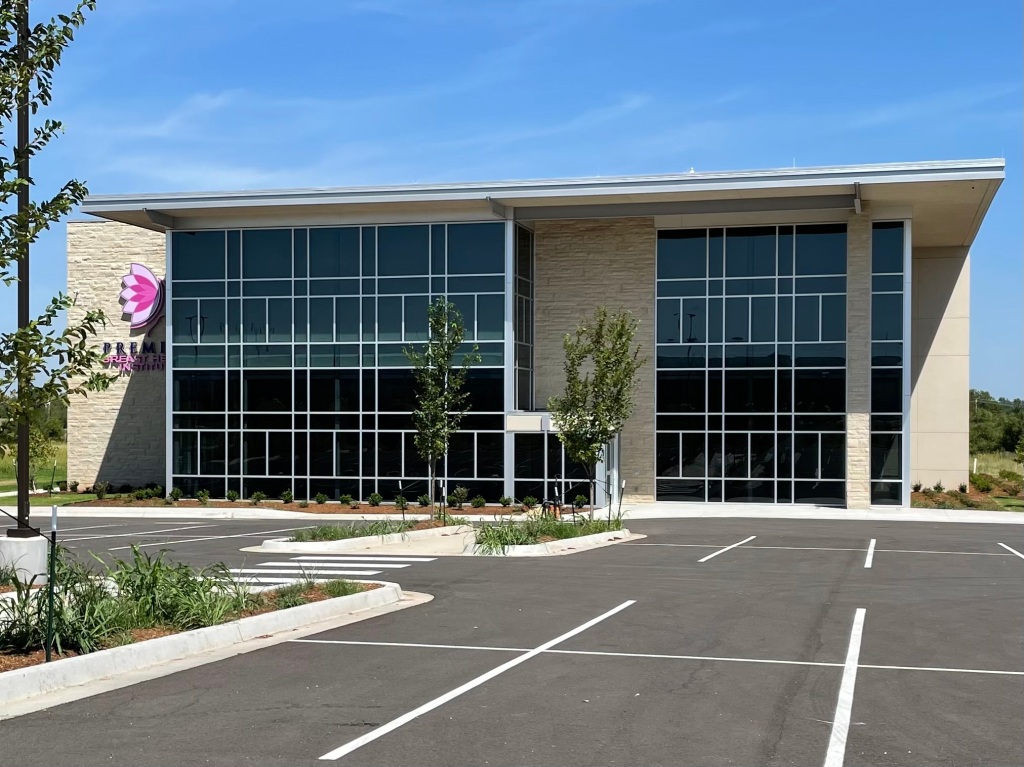
I’m going to end it there, but with a plug for a new breast center opening soon in OKC (SW 89th & I-44), where we will have Contrast Enhanced Mammography as an option, as well as a High-Density clinic to accompany the High-Risk Clinic. More information to follow, but the Premier Breast Health Institute of Oklahoma will be opening its doors in the fall, 2023.
CLINICAL LEADERSHIP
Stephanie Taylor, MD — lead breast surgeon
Anna Stidham, MD — lead breast radiologist
Courtney Carrier, MPH, MSN, APRN, NP-C — genetic testing, risk assessment, High-risk/High-density clinic
Alan Hollingsworth, MD — research director
Barbara Mortellaro, manager
EXECUTIVE LEADERSHIP — Allied Health Management
Tom Welch, President and CEO
David Raubach, Chief Development Officer
Chris Brown, CFO